
Every global enterprise faces the challenge of piecing together scattered customer data to reveal the full picture. For digital marketing professionals and data analysts, traditional analytics miss the mark when it comes to understanding the deeper motivations and pain points hidden in every interaction. With customer journey mapping as a visual representation of experiences across channels, your team gains the clarity needed to align strategy, identify friction, and enhance satisfaction at every critical touchpoint.
Table of Contents
- Defining Customer Journey Mapping In Marketing
- What Makes A Journey Map Valuable
- Why This Matters For Your Organization
- Mapping Types And Critical Journey Stages
- Understanding Core Mapping Types
- The Critical Journey Stages
- Why Stage Definition Matters
- Key Data Sources And Measurement Metrics
- Essential Data Sources
- Critical Metrics To Track
- Integration Over Perfection
- Integrating Journey Maps With Martech Stack
- Why Integration Matters
- Key Integration Points
- Building The Integration Architecture
- Common Pitfalls And Optimization Insights
- The Biggest Mistakes Teams Make
- The Perfection Trap
- Translating Insights Into Action
Key Takeaways
| Point | Details |
|---|---|
| Customer Journey Mapping Enhances Understanding | It creates a visual representation of customer interactions, revealing emotions and motivations at each touchpoint. |
| Dynamic Maps Foster Team Alignment | They unify departments around a common understanding, reducing blame and misalignment in strategy. |
| Data Integration is Essential | Consolidating data from various sources leads to actionable insights and improved decision-making. |
| Focus on Actionable Outcomes | Without translating insights into improvements, journey maps serve little purpose and can become mere artifacts. |
Defining Customer Journey Mapping in Marketing
Customer journey mapping transforms how you understand your audience. At its core, it’s the process of creating a visual representation of every interaction a customer has with your brand across all channels and touchpoints. Unlike generic customer profiles, these maps capture the complete story of how someone moves from awareness through purchase and beyond.
Visual representations that show customer experiences across channels go beyond listing contacts. They illuminate what customers think, feel, and experience at each stage. For data-driven marketers working in large enterprises, this means understanding not just what happened, but why it happened and what triggered each decision.
Think of it as building a 360-degree view of customer engagement. Your journey map becomes the bridge between raw behavioral data and actionable marketing strategy. It’s where analytics, psychology, and business objectives collide.
What Makes a Journey Map Valuable
A properly constructed journey map reveals critical patterns your standard analytics dashboards miss. The key elements include:
- Timelines that show when interactions occur and their sequence
- Channels identifying where customers engage (email, web, app, social, in-person)
- Touchpoints representing specific moments of interaction
- Customer emotions and motivations at each stage
- Pain points where friction prevents forward momentum
- Moments of delight that create loyalty opportunities
Structured approaches that identify motivation and pain points transform customer journey mapping from a static exercise into a dynamic strategic tool. Your team moves from guessing what customers want to knowing exactly where they struggle.
For enterprises managing complex customer bases, this precision matters enormously. When multiple teams work from the same visual reference, misalignment disappears. Sales stops blaming marketing for poor leads. Marketing stops blaming product for feature limitations. Everyone sees the same customer reality.

Why This Matters for Your Organization
Your organization likely has customer data scattered across multiple platforms. Email engagement lives in one system. Website behavior in another. Purchase history in a third. Journey mapping synthesizes this fragmented data into a coherent narrative.
This synthesis directly improves decision-making. Teams prioritize initiatives based on where customers experience the most friction, not on department politics. Marketing budgets shift toward channels where target customers actually spend time. Product development addresses genuine customer needs, not assumed ones.
The real competitive advantage emerges when you integrate real-time data into your journey maps. Static maps become outdated quickly. Dynamic frameworks that evolve with customer behavior changes keep your strategy perpetually aligned with market reality.
A customer journey map transforms disconnected data points into strategic insights that drive measurable improvements across your entire organization.
Pro tip: Start your mapping process by identifying your highest-value customer segment, then trace their actual journey through your analytics data before assuming any pain points—let the data speak first, then validate with direct customer interviews.
Mapping Types and Critical Journey Stages
Not all journey maps are created equal. Different business models and customer segments require different mapping approaches. Your organization needs to understand which type of map answers your specific strategic questions.
Understanding Core Mapping Types
Journey maps come in several distinct flavors, each serving different analytical purposes.
Current state maps show how customers actually interact with your brand today. These maps reveal existing friction points and help teams understand present performance. They’re built from real data: behavioral analytics, support tickets, session recordings, and customer interviews.
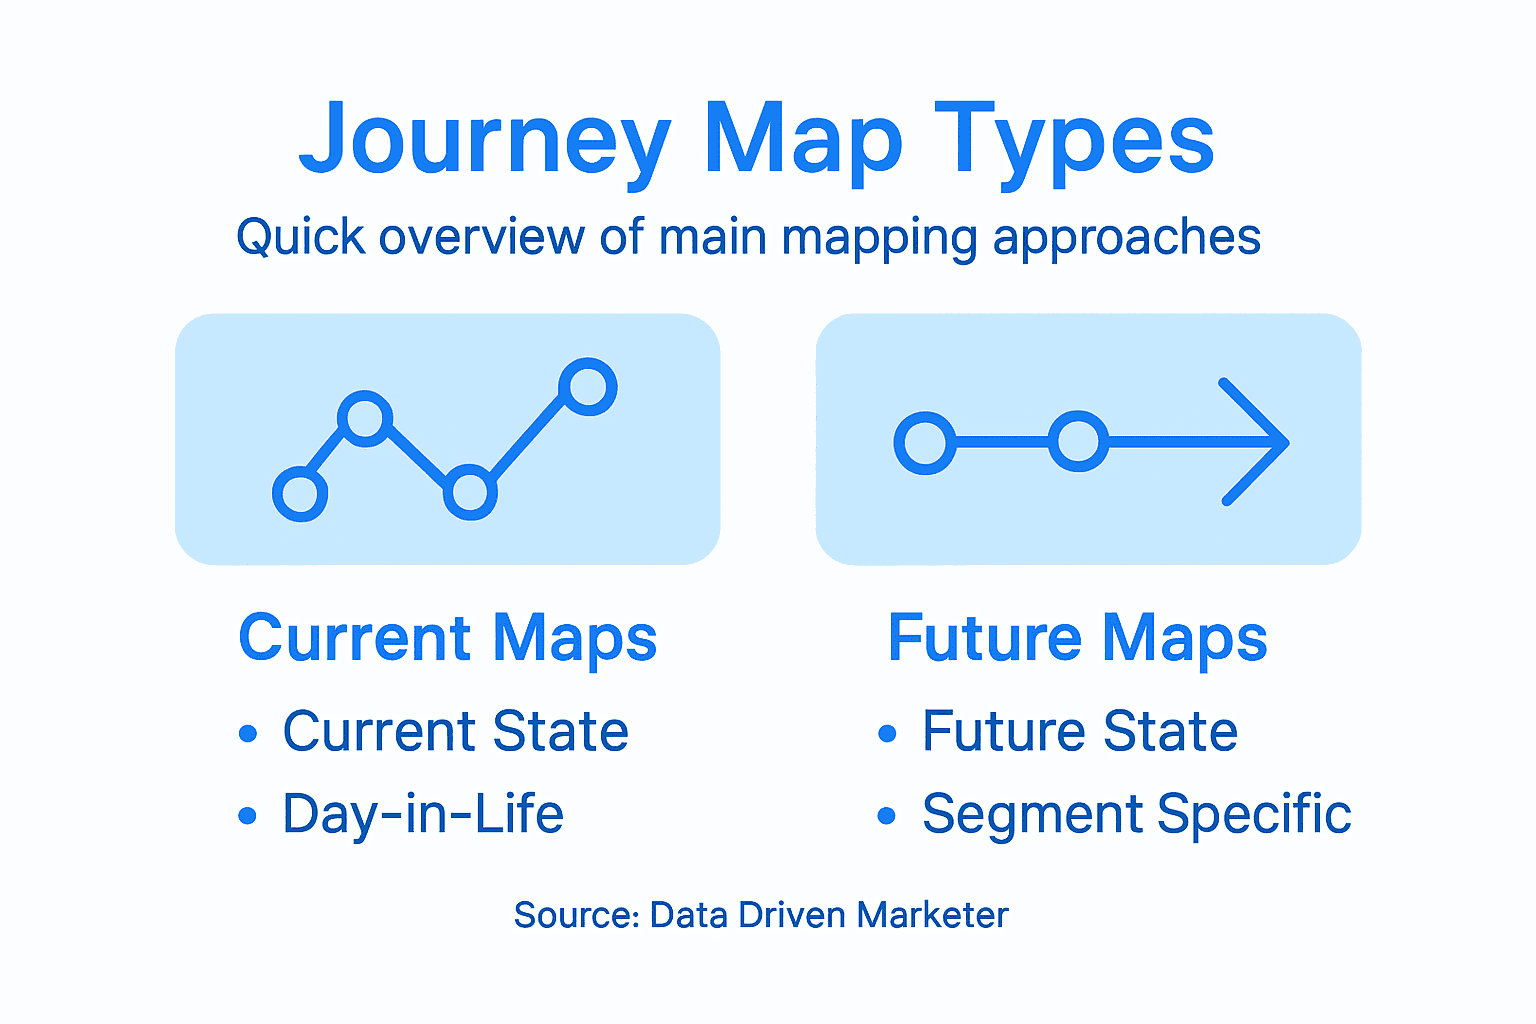
Future state maps envision how customers should interact after your improvements. They represent the ideal experience you’re designing toward. Product teams use these maps to align development roadmaps with customer needs.
Day-in-the-life maps zoom out to show the broader context surrounding your specific touchpoints. A customer’s journey with your martech platform doesn’t exist in isolation. They’re also managing budget approvals, team coordination, and competing vendor evaluations. These maps acknowledge that reality.
Segment-specific maps recognize that different customer personas experience your brand differently. A large enterprise buyer navigates your sales process far differently than a self-service SMB customer. One-size-fits-all maps mask these critical variations.
Here’s a quick comparison of core customer journey mapping types and their business applications:
| Map Type | Main Focus | Typical Use Case |
|---|---|---|
| Current State | Real customer interactions and pain points | Diagnosing issues, quick wins |
| Future State | Ideal experience after improvements | Vision planning, innovation |
| Day-in-the-Life | Context beyond your brand’s touchpoints | Finding external influences |
| Segment-Specific | Differentiated journeys for distinct personas | Personalizing marketing strategy |
The Critical Journey Stages
Step-by-step user interactions with a service require careful stage definition. For data-driven marketers, these stages form the structural backbone where all metrics align.
Most B2B and B2C journeys follow this framework:
- Awareness – Customer recognizes a problem exists or discovers your brand
- Consideration – Prospect researches solutions and evaluates alternatives
- Decision – Customer chooses your offering over competitors
- Onboarding – New customer learns your product and experiences initial value
- Adoption – Customer integrates your solution into regular workflows
- Advocacy – Satisfied customer recommends you to others
Each stage demands specific attention. Awareness requires different metrics than adoption. The channels customers use differ. The emotions they experience vary dramatically.
Map the emotional journey alongside the behavioral one—emotions predict retention and expansion better than transaction history alone.
Why Stage Definition Matters
Capturing actions, pain points, and emotional flows across stages transforms disconnected data into strategic narrative. When marketing measures awareness metrics while sales measures decision metrics, nobody understands the full picture.
Clear stage definitions align your entire organization. Customer success teams know when handoff happens from sales. Product teams understand which features impact which stages most. Finance can track investment returns by stage.
Enterprise marketers often miss the stages before awareness and after advocacy. Pre-awareness research influences how quickly prospects move through consideration. Post-purchase advocacy determines expansion revenue. Incomplete stage mapping leaves money on the table.
Pro tip: Map your existing customer segments through your current stages using actual data from your analytics platform, then identify which stage experiences the highest drop-off rate—that becomes your highest-ROI improvement opportunity.
Key Data Sources and Measurement Metrics
Your journey map is only as valuable as the data feeding it. Quality data transforms maps from theoretical exercises into operational tools that drive real decisions. For enterprise marketing teams, data integration becomes the critical enabler of strategic execution.
Essential Data Sources
Building a comprehensive journey map requires pulling from multiple systems. Siloed data creates incomplete pictures. Here’s where the real insights hide:
- Web analytics platforms track behavioral data, session flows, and time-on-page metrics across digital touchpoints
- CRM systems capture sales interactions, deal progression, and customer communication history
- Customer feedback tools reveal qualitative insights through surveys, support tickets, and user interviews
- Email marketing platforms show engagement patterns, open rates, and click-through behaviors
- Product analytics detail feature adoption, user flows, and in-app behaviors
- Attribution models connect marketing touchpoints to revenue outcomes
- Call center recordings provide unfiltered insight into customer concerns and objections
Diverse data sources such as web analytics and customer feedback give you the full picture. But raw data without integration remains scattered insight.
Enterprise organizations that win consolidate these sources into unified dashboards. Marketing stops guessing what sales needs. Product stops building features nobody uses.
Critical Metrics to Track
Not all metrics matter equally. Choose metrics that directly impact business outcomes and customer experience. Key metrics include:
- Conversion rates at each stage showing progression velocity
- Channel effectiveness revealing which touchpoints drive actual outcomes
- Customer satisfaction scores measuring emotional sentiment
- Time-to-conversion indicating friction or acceleration points
- Drop-off rates pinpointing where customers abandon their journey
- Cost per acquisition by stage for budget optimization
- Customer lifetime value segments showing long-term profitability
Real-time data analytics enables continuous tracking and optimization of customer interactions. Static monthly reports become historical artifacts. Dynamic dashboards reveal what’s happening now.
This shift from retrospective to real-time transforms your competitive advantage. When competitors analyze last month’s data, you’re already adapting to this week’s customer behavior changes.
Use this table for a snapshot of critical metrics and where they impact business outcomes:
| Metric | Business Impact | Optimized Stage |
|---|---|---|
| Conversion Rate | Increase in leads and sales | Decision, Onboarding |
| Drop-off Rate | Identifies lost revenue opportunities | Consideration, Adoption |
| Customer Satisfaction | Predicts renewal and advocacy | Adoption, Advocacy |
| Channel Effectiveness | Informs budget allocation | All stages |
| Time-to-Conversion | Reveals friction or efficiency gains | Decision |
Integration Over Perfection
The best journey map uses 80 percent of your data integrated today rather than waiting for 100 percent of perfect data next quarter. Start with your most critical metrics and data sources, then layer in additional insights.
Integrated data that’s 80 percent complete today beats perfect data that arrives too late to influence decisions.
Measuring customer experience across stages reveals where emotional commitment peaks and where friction causes defection. Your finance team can now track ROI by specific customer journey stages, not just aggregate campaign metrics.
Pro tip: Audit your current data sources this week and identify which ones already talk to each other versus which ones require manual reconciliation—then prioritize integrating the disconnected sources that track high-value customer segments.
Integrating Journey Maps With Martech Stack
Your martech stack exists to serve your customer strategy. Yet most organizations treat journey maps and martech as separate concerns. They’re not. Integration transforms both into something far more powerful.
When your journey map connects directly to your marketing technology platforms, static visualizations become dynamic operational systems. Real data flows continuously. Insights translate instantly into personalized customer experiences.
Why Integration Matters
Fragmented tools create fragmented customer experiences. Your email platform doesn’t know what your CRM is tracking. Your analytics tool operates independently from your ad platform. Customers experience your brand as disconnected touchpoints rather than cohesive journeys.
Integration solves this. Software applications that automate, track, and optimize marketing efforts work best when guided by clear journey maps. Your journey map becomes the blueprint. Your martech becomes the execution engine.
Enterprise teams that win align their technology stack to reinforce their journey maps, not fight them. This requires honest assessment of what your current tools actually do versus what you assumed they do.
Key Integration Points
Start with these critical connections:
- CRM systems pull journey stage data from web behavior and engagement history
- Email platforms segment audiences based on journey stage and personalize messaging accordingly
- Analytics tools track progression through defined journey stages in real-time
- Attribution platforms connect touchpoints to revenue outcomes at specific journey moments
- Ad platforms target customers based on their current journey position
- Personalization engines adapt content dynamically based on journey context
Integration of real-time data analytics with journey mapping facilitates dynamic tracking of customer interactions. Your teams move from quarterly reporting to instant visibility. When a segment stalls at decision stage, you see it immediately and adjust tactics.
This speed advantage compounds over time. Competitors running monthly analysis cycles cannot react fast enough to address emerging friction points.
Building the Integration Architecture
Successful integration starts with clarity. Define exactly which journey stages map to which martech actions. Document which data flows where. Identify integration gaps.
Journey maps guide martech strategy; martech executes journey strategy. Neither works alone.
Your best performing segments reveal what integration looks like at scale. Trace how high-value customers move through your systems. Which touchpoints accelerate them? Which delay them? These patterns become your integration priority.
Most enterprises discover their martech stacks actually support only 40 to 60 percent of their journey maps. The remaining stages require custom development or tool additions. This gap analysis drives smarter technology investment decisions.
Pro tip: Map your three highest-value customer segments through your existing martech touchpoints this week, then document which journey stages lack supporting automation—those gaps become your next martech investment priorities.
Common Pitfalls and Optimization Insights
Most organizations fail not because their journey maps are wrong, but because they never act on them. The map becomes a beautiful artifact that sits in a shared drive while business continues unchanged. This disconnect between mapping and action destroys value.
The Biggest Mistakes Teams Make
Companies often focus obsessively on the mapping process itself rather than the outcomes it should drive. They spend months perfecting visual design while ignoring whether the map actually influences decisions. This backwards priority wastes resources.
Other common mistakes include:
- Lack of clear objectives before starting—you need measurable goals upfront
- Insufficient stakeholder involvement—sales, product, and customer success must shape the map, not just marketing
- One-time exercises—journey maps become stale; they need continuous updates
- Ignoring emotional complexity—oversimplifying customer experience to a linear flow
- No connection to strategy—insights never translate to actual resource allocation
Failing to connect journey insights to strategic change guarantees limited impact. Your map could be brilliant, but if leadership doesn’t fund improvements based on it, nothing changes.
Enterprise teams that win start with one burning question: What do we need to learn from our customers right now? The map serves that question, not the other way around.
The Perfection Trap
There’s a seductive notion that frictionless customer experiences drive loyalty. Not true. Making every interaction effortless can oversimplify experiences and reduce engagement.
Think about experiences you actually value. They rarely feel completely smooth. They contain moments of discovery, small surprises, and meaningful friction that matters. A customer who never questions their choice doesn’t feel loyalty—they just feel indifferent.
Optimization means designing journeys that maintain interest and emotional connection, not eliminating all resistance. Some friction is actually healthy friction.
Translating Insights Into Action
Your journey map only matters if it changes behavior. Set measurable objectives before mapping. Involve cross-functional teams early. Most importantly, maintain momentum by translating findings into concrete improvements.
Maps reveal opportunities; action realizes value. Without action, maps are expensive decorations.
Pick one high-impact opportunity from your map. Allocate budget. Assign ownership. Measure results. Let success with one improvement build credibility for the next. Small wins compound into transformation.
Enterprise organizations often discover that their highest-friction moments offer their biggest improvement opportunities. The bottleneck at decision stage? Fix it and watch conversion rates accelerate. The abandoned onboarding experience? Address it and expansion revenue increases. These aren’t subtle improvements.
Pro tip: Before finalizing your journey map, identify which stage creates your biggest revenue leak, then secure budget and ownership to pilot one specific improvement in that stage—measure the impact rigorously, then use those results to justify larger improvements across the entire journey.
Unlock the Full Potential of Customer Journey Mapping with Data Driven Marketer
Understanding customer friction points and integrating real-time data into your journey maps are critical steps discussed in the article Customer Journey Mapping Transforming Digital Strategy. If you struggle with fragmented data, unclear customer stage definitions, or disconnected martech tools that hinder your marketing efficiency Data Driven Marketer offers expert guidance to help you master these challenges. Discover strategies to unify your customer data sources drive actionable insights and create dynamic customer experiences that actually move the needle.
Start transforming your digital strategy today by exploring the wealth of in-depth articles and case studies at Data Driven Marketer. Dive deeper into marketing control planes data analytics and tech stack optimization to build journey maps that deliver measurable ROI. Don’t let static maps and scattered data hold your marketing back act now and harness the power of technology-driven frameworks to revolutionize your customer engagement.
Frequently Asked Questions
What is customer journey mapping?
Customer journey mapping is the process of creating a visual representation of every interaction a customer has with your brand across various channels and touchpoints, encompassing the entire journey from awareness to purchase and beyond.
Why is customer journey mapping important for organizations?
It allows organizations to synthesize fragmented customer data into coherent narratives, enabling better decision-making, prioritization of initiatives, and alignment across teams. This ultimately leads to improved customer experiences and strategic outcomes.
What types of customer journey maps are there?
There are several types, including current state maps (showing actual interactions), future state maps (envisioning ideal experiences), day-in-the-life maps (providing broader context), and segment-specific maps (tailored to different personas).
What metrics should be tracked in customer journey mapping?
Key metrics include conversion rates at each stage, drop-off rates to identify lost revenue opportunities, customer satisfaction scores to gauge emotional sentiment, and time-to-conversion to indicate friction points in the process.
Recommended
- Mastering Digital Customer Journey Mapping: A Marketer’s Blueprint – The data driven marketer
- Customer Journey Mapping: Ultimate Guide for Seamless Experiences – The data driven marketer
- Data-Driven B2B Customer Journey Mapping – The data driven marketer
- Mastering Digital Customer Journey Mapping – The data driven marketer
- Performance Marketing Team | Multi‑Channel Paid Ads
- Master Digital Marketing Workflow for Lead Generation Success – Done