
TL;DR:
- Marketing teams relying on gut instinct waste up to 26% of campaign budgets targeting wrong audiences. Business intelligence transforms raw data into actionable insights, improving decision speed and precision. Success depends on data quality, governance, and focusing on key KPIs to drive measurable ROI.
Marketing teams that rely on gut instinct over structured data waste up to 26 cents of every dollar spent on campaigns targeting the wrong audiences. Business intelligence (BI) for marketing is the technology-enabled process of collecting, integrating, analyzing, and visualizing marketing data from multiple sources to enable data-driven decisions. Many teams assume BI is reserved for Fortune 500 companies with massive data engineering budgets. That assumption is costing mid-market and growth-stage organizations real money. This guide breaks down exactly what BI means for marketers, how to apply its core methodologies, and what outcomes you can realistically expect.
Table of Contents
- What is business intelligence for marketing?
- Core methodologies: From segmentation to ROI
- Best practices: Data quality, integration, and governance
- Business value and outcomes: Measuring BI’s impact
- A hard truth for marketers: BI’s promise vs. reality
- Advance your marketing intelligence with the right tools
- Frequently asked questions
Key Takeaways
| Point | Details |
|---|---|
| Clear definition | Business intelligence for marketing means using integrated data for smarter, faster decisions. |
| Core methods | Segmentation, ROI tracking, CLV, and predictive analytics help marketers target and measure effectively. |
| Data quality matters | High-quality, governed data ensures BI delivers actionable insights, not just reports. |
| Tangible ROI | BI can deliver 5-8x returns on campaigns and dramatically shorten analysis cycles. |
| Focus over volume | Marketing success comes from tracking a few key KPIs, not dozens of metrics. |
What is business intelligence for marketing?
At its core, marketing BI is about turning raw data into decisions you can act on with confidence. It is not just a dashboard or a reporting tool. It is a connected system that pulls data from every channel you operate, makes sense of it, and surfaces insights that drive strategy.
The core components of a marketing BI system include data integration, centralized databases, KPI tracking, interactive dashboards, and predictive analytics. Each layer builds on the previous one. Without solid integration, your dashboards are just showing you fragments of reality.
Here is what a typical marketing BI stack draws from:
- CRM platforms (Salesforce, HubSpot) for customer lifecycle and pipeline data
- Web analytics tools (Google Analytics 4, Adobe Analytics) for behavioral data
- Paid media platforms (Google Ads, Meta Ads) for spend and performance data
- Email marketing systems for open rates, click-through rates, and conversion data
- SEO tools for organic visibility and keyword performance
- Data warehouses (BigQuery, Snowflake) for unified storage and querying
Proper marketing data integration across these sources is what separates a functioning BI system from a collection of disconnected reports.
“The goal of marketing BI is not to collect more data. It is to make better decisions faster, with the data you already have.”
Here is a quick comparison of traditional reporting versus a full BI approach:
| Capability | Traditional reporting | Marketing BI |
|---|---|---|
| Data sources | Single platform | Multi-source, integrated |
| Update frequency | Weekly or monthly | Real-time or daily |
| Insight type | Descriptive (what happened) | Predictive (what will happen) |
| Decision speed | Slow, manual | Fast, automated alerts |
| Audience targeting | Broad segments | Behavioral microsegments |
The shift from traditional reporting to BI is not just technical. It changes how marketing teams operate, prioritize, and justify budget decisions to leadership.
Core methodologies: From segmentation to ROI
Knowing what BI is only gets you halfway. The real value comes from applying its methodologies consistently across your marketing operations. Key methodologies include audience segmentation, ROI and ROAS measurement, customer lifetime value (CLV) modeling, 360-degree customer views, predictive analytics, and competitor analysis.
Here is how each plays out in practice:
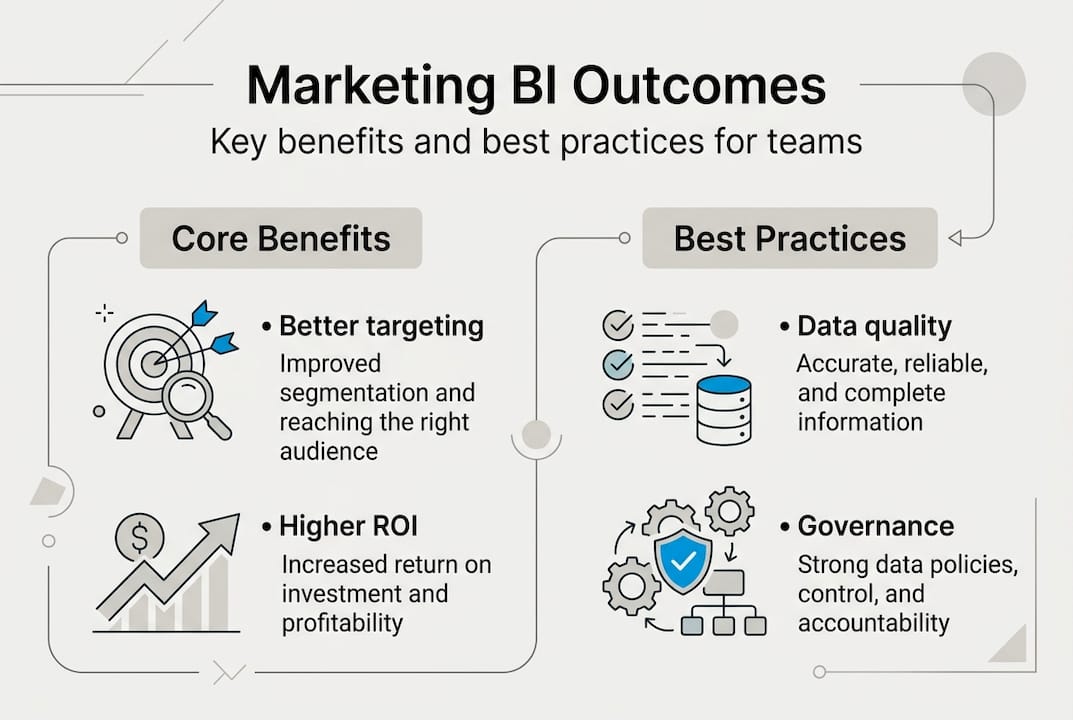
- Audience segmentation: Group customers by demographics, purchase behavior, and engagement patterns to deliver personalized messaging that converts.
- ROAS and ROI measurement: Calculate return on ad spend per channel to reallocate budget from underperforming campaigns to high-yield ones.
- CLV modeling: Predict the long-term revenue value of a customer segment to justify acquisition costs and retention investment.
- 360-degree customer view: Combine CRM, behavioral, and transactional data to build a unified profile that informs personalization at every touchpoint.
- Competitor analysis: Benchmark your share of voice, pricing positioning, and content performance against key competitors.
- Predictive analytics in marketing: Use historical patterns to forecast campaign outcomes, churn risk, and demand shifts before they happen.
The KPIs that matter most in a marketing BI context include customer acquisition cost (CAC), CLV to CAC ratio, ROAS by channel, conversion rate by funnel stage, email engagement rate, organic traffic growth, and pipeline velocity. That is seven. Resist the urge to track 40.
Pro Tip: Set a rule in your team that no new KPI gets added to your core dashboard without removing or consolidating an existing one. Metric sprawl is one of the fastest ways to kill BI adoption inside a marketing team.
One of the most overlooked BI methodologies is marketing measurement accuracy. Even the most sophisticated segmentation model fails if the underlying event data is broken, duplicated, or missing consent signals. Methodology without data integrity is theater.
| Methodology | Primary output | Common mistake |
|---|---|---|
| Audience segmentation | Targeted campaigns | Over-segmenting with too little data |
| ROAS measurement | Budget reallocation | Ignoring view-through attribution |
| CLV modeling | Retention prioritization | Using average CLV instead of segment CLV |
| Predictive analytics | Proactive campaign planning | Training models on dirty data |
Best practices: Data quality, integration, and governance
Here is the uncomfortable reality: most BI projects do not fail because of the wrong tool. They fail because the data feeding those tools is unreliable. BI success requires data quality, governance, and a disciplined focus on a limited set of KPIs to avoid analysis paralysis.
Data quality in a marketing context means your tracking events fire correctly, your UTM parameters are consistent, your CRM fields are populated, and your ad platform conversions are deduplicated. It is operational, not theoretical.
Here are the five practices that separate high-performing marketing BI teams from struggling ones:
- Establish clear data ownership: Every data source needs a named owner accountable for its accuracy and completeness.
- Implement ETL/ELT pipelines with validation checks: Do not just move data. Validate it at every transformation step to catch issues before they reach your dashboards.
- Standardize taxonomy and naming conventions: Inconsistent event names across platforms create silent errors that corrupt reporting.
- Audit tracking implementations regularly: Pixels break, consent configurations change, and tag managers get misconfigured. Continuous monitoring is not optional.
- Document your data model: If only one person on your team understands how your data is structured, you have a governance risk, not a BI system.
Pro Tip: Before investing in a new BI tool or dashboard layer, run a marketing data quality audit on your existing sources. You will almost always find broken events, missing parameters, or attribution gaps that inflate or deflate your reported performance.
Robust marketing data governance is what keeps BI scalable over time. Without it, every new data source you add increases entropy instead of insight. Governance creates the rules that make integration sustainable.

Fragmented data is the silent killer of marketing BI. When your paid media data lives in one silo, your CRM in another, and your web analytics in a third, no amount of visualization tooling fixes the underlying gap. Investing in data integrity solutions early saves exponentially more time than retrofitting them later.
Business value and outcomes: Measuring BI’s impact
The business case for marketing BI is not abstract. The numbers are clear. Data-driven personalization yields 5 to 8 times ROI on campaigns. A Forrester Total Economic Impact study on the Zeta Marketing Platform found a 6x return on ad spend, 295% ROI on technology investment, $21.4 million in net present value over three years, and a 50% reduction in campaign setup time.
Those numbers are not outliers. They reflect what happens when BI fundamentals are implemented correctly.
“Organizations that treat data quality as a prerequisite, not an afterthought, consistently outperform those chasing the latest analytics trend.”
Here is a summary of documented BI impact benchmarks:
| Metric | Benchmark result | Source type |
|---|---|---|
| Campaign ROI lift | 5 to 8x via personalization | Industry research |
| Ad spend return | 6x ROAS | Forrester TEI study |
| Tech investment ROI | 295% over 3 years | Forrester TEI study |
| Campaign setup time | 50% reduction | Forrester TEI study |
| NPV over 3 years | $21.4 million | Forrester TEI study |
Why do some BI initiatives succeed while others stall? The pattern is consistent. Successful teams start with big data in marketing fundamentals: clean data, defined KPIs, and cross-functional alignment. Failing teams start with the tool and work backward, hoping the platform will solve the data problem for them.
The organizations getting the most value from BI are also the ones following data analytics best practices that prioritize measurement infrastructure before optimization. You cannot optimize what you cannot accurately measure.
When framing a BI business case internally, lead with time savings and error reduction before ROI projections. Leadership trusts operational efficiency gains more than projected revenue lifts, especially in early-stage BI adoption.
A hard truth for marketers: BI’s promise vs. reality
Most BI projects underdeliver not because the technology is wrong, but because teams skip the boring work. Data quality audits, governance documentation, and taxonomy standardization are not exciting. They do not make for good conference presentations. But they are the actual foundation of every BI success story you read about.
The AI and machine learning hype cycle has made this worse. Teams are rushing to build predictive models on top of data that has not been validated in months. The model outputs look impressive in a demo and fall apart in production. This is not a technology failure. It is a sequencing failure.
Small and mid-sized marketing teams should resist the pressure to build a 30-KPI dashboard just because enterprise competitors do. Pick five metrics that directly connect to revenue, track them obsessively, and build from there. Discipline in measurement creates clarity in strategy.
The one actionable takeaway for any team starting their BI journey: invest in data-driven growth strategies that begin with data reliability, not data volume. More data from broken sources is not an asset. It is noise with extra steps.
Advance your marketing intelligence with the right tools
Putting BI principles into practice requires more than a strategy document. You need the right stack, the right governance model, and continuous visibility into whether your data is trustworthy. Platforms like Trackingplan give marketing and analytics teams automated monitoring of their tracking implementations, so broken pixels, misconfigured tags, and consent issues get caught before they corrupt your reporting.
If you are ready to move from reactive debugging to proactive data quality, explore the curated guides on digital marketing tools and data quality metrics at Data Driven Marketer. The resources cover everything from governance frameworks to tool selection, giving your team a clear path forward.
Frequently asked questions
What are the main benefits of business intelligence for marketing?
Business intelligence gives marketers greater precision in campaign targeting, more accurate ROI measurement, and faster insights for data-driven decision-making across all channels.
How does BI improve marketing ROI?
BI improves marketing ROI by enabling data-driven personalization that yields 5 to 8x returns on campaigns, identifying the highest-performing channels, and eliminating wasted ad spend through precise attribution.
What types of data are used in marketing BI?
Marketing BI uses CRM, email, web analytics, paid media platforms, and demographic data to build a unified view of customer behavior and campaign performance.
Is BI only relevant for large organizations?
No. Even small and mid-sized marketing teams benefit from BI by focusing on a core set of KPIs that connect directly to revenue, without needing enterprise-scale infrastructure to get started.
Recommended
- Unlock data driven marketing insights to boost ROI – The data driven marketer
- Marketing Data Visualization: Driving Smarter Decisions – The data driven marketer
- Unlocking Marketing Insights with Talend Data Integration – The data driven marketer
- Mastering B2B Marketing Analytics: Strategies for Data-Driven Growth – The data driven marketer
- How to Grow AI Engine Engagement: A Step-by-Step Framework for AEO and SEO Success – 1on1 SEO